Micro-Rebalancing Strategy Results - Proof
Real Trades. Real Proof. Real Results.
You're Watching Your Portfolio Swing Thousands of Dollars... And Doing Nothing About It
You know the market moves. You see the volatility.
But Buy & Hold says "ignore it" and Active Trading says "predict it."
What if there's a third way?
QQQ: Buy & Hold made $14,738. Micro-Rebalancing made $36,127.
Same stock. Same timeframe. That's $21,389 more—without predicting anything.
Think that's cherry-picked? Here's every single trade, timestamped and confirmed.
The QQQ Results: October 2020 - February 2022
🔗Click to View Full QQQ Analysis →
The Numbers
MicroRebalancing:
- Total profit extracted: $36,127.60
- Return: 15.24%
- Position retained: 413 shares of QQQ (still compounding)
Buy & Hold:
- Total profit: $14,738.16
- Return: 6.22%
- Position retained: Zero (sold entire position to realize gains)
MicroRebalancing Advantage:
- $21,389 more profit (145% higher returns)
- Plus ongoing exposure to continue compounding
Watch The Proof (2 Minutes)
QQQ – Nasdaq 100 ETF Strategy
🔗Click to View Full Trade Confirmations & Spreadsheet Log →
See the actual trade confirmations scrolling alongside the spreadsheet tracker. Every buy, every sell, every trigger point—documented and matched.
What you'll see:
- Real trade confirmations from the brokerage
- Spreadsheet entries matching each trade
- The mechanical execution of the system
- No predictions, no emotions, just triggers
The SPY Results: September 2020 - February 2022
Want a second example? Here's the full breakdown with SPY—the most popular S&P 500 ETF.
🔗Click To View Full SPY Analysis →
The Numbers
MicroRebalancing:
- Total profit extracted: $42,233.43
- Return: 23.8%
- Position retained: $152,000+ in SPY (still compounding)
Buy & Hold:
- Total profit: $27,703.60
- Return: 15%
- Position retained: Zero (sold entire position to realize gains)
MicroRebalancing Advantage:
- $14,530 more profit (52.45% higher returns)
- Plus $152k position still working
Watch The Full Analysis (7 Minutes)
SPY– S&P 500 ETF Strategy: 2020 to 2022
Key timestamps:
- 0:43 Trade confirmation scroll
- 1:28 Comparison begins
- 5:23 Buy and Hold Results
- 5:51 MR results
This is the complete forensic breakdown. If you're analytical and want to see every detail of how the comparison works, this video walks through:
- Every major buy and sell
- Cost basis calculations
- The complete profit extraction process
- Why MR outperformed even with the same market conditions
🔗View Trade Confirmations & Blotter for SPY →
See How MicroRebalancing Performed On Ford Stock
The system systematically outperforms passive investing even on a slower-moving, dividend-paying blue chip.
Why MicroRebalancing Wins
Here's what makes the difference:
1. Takes Profits Without Exiting
Buy & Hold forces you to choose: keep holding and risk giving back gains, or sell everything and miss future upside. MR extracts profits incrementally while keeping you in the game.
2. Turns Volatility Into Profit
Every price swing is an opportunity. When the price drops below your Target Allocation, you buy more. When it rises above, you trim and take profit. The market's movement becomes your advantage.
3. No Predictions Required
You're not trying to guess tops or bottoms. You're following mechanical rules: price crosses threshold → execute trade. That's it.
4. Compounds Continuously
Buy & Hold waits years for gains. MR extracts profits within days or weeks, then reinvests them. Your money works harder, faster.
5. Reduces Risk Through Discipline
By automatically trimming winners and adding to losers (when they hit thresholds), you're constantly rebalancing risk without emotional decision-making.
Want To Verify Every Trade?
We've published the complete trade logs, spreadsheet trackers, and brokerage confirmations:
- Trade confirmations
- Spreadsheet tracker
- Full methodology
Multi-Stock Daily Snapshots:
Single-day trade logs showing MR across multiple positions simultaneously:
View Trades →
View Trades →
Positions covered: SPY, QQQ, AMD, NVDA, PLTR, ORCL, Ford, ARKK, TSLA, MSFT, FB, and more.
The 30-Year Potential (Backtested Simulation)
Curious what this system looks like over a full market cycle? We ran a 30-year backtest on SPY from 1995-2024.
Important: This is theoretical backtesting, not real trades. The results above (QQQ and SPY) are actual executed trades. This simulation shows what could have happened historically.
Simulation Results: SPY 1995-2024
Starting portfolio: $1,000
Buy & Hold Result:
- Final value: $21,790
- CAGR: 11%
MicroRebalancing (1% triggers):
- Final value: $1-5 million (realistic twice-daily execution)
- CAGR: 26.1%
- Trades: ~11,340 over 30 years
MicroRebalancing (0.1% triggers):
- Final value: $10-50 million (with automation/perfect execution)
- CAGR: 43.5%
- Trades: ~75,000 over 30 years (requires automation)
The tighter your trigger bands, the more you capture volatility and compound gains. The tradeoff is execution frequency—wider bands are more practical for manual trading, tighter bands reward automation.
Key Insight: Even with practical 1% triggers and twice-daily checks, MR turns $1,000 into over $1 million while Buy & Hold makes $21,790. That's the power of compounding captured volatility over time.
Full simulation methodology and data →
Market Conditions Tested
These results cover:
✅ Bull markets - Late 2020 tech surge
✅ Crashes - 2022 market correction
✅ Sideways action - Choppy 2021 periods
✅ Recovery periods - Post-crash rebounds
MR didn't just work in one environment. It worked through all of them.
The system isn't about timing the market. It's about using the market.
Ready To Learn The System?
You've seen the proof. Now learn how to do it yourself.
New to MicroRebalancing?
Start with the safer, beginner-friendly approach:
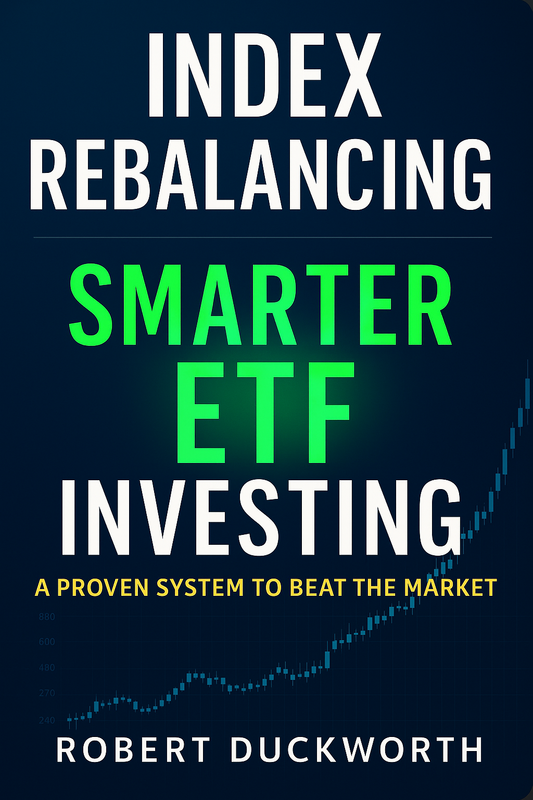
Index Rebalancing: The Smarter Way to Invest in ETFs
- Learn MR principles using index ETFs (SPY, QQQ, VOO)
- 56 pages, visual interactive PDF
- Lower risk entry point
- Regular $10 | On Sale: $5
Start with Index Rebalancing →
Want The Complete System?
Get everything—books, tools, training, lifetime updates:
MicroRebalancing VIP Toolkit - $37
Includes:
- ✅ All 3 books ($35 value)
- ISM: Institutional Style Management foundation
- Index Rebalancing: ETF-focused entry guide
- MicroRebalancing Standard Edition: 270+ page complete system
- ✅ Professional spreadsheet trackers
- ✅ Video training (28 minutes)
- ✅ Cash reserve management guide
- ✅ Bot script samples
- ✅ Hidden leveraging techniques
- ✅ Lifetime updates (all future editions free)
Founding Member Price: $37 (One-time payment, no subscriptions)
This price is locked for early adopters. Future price increases will not affect you.
Want Just The Advanced Book?
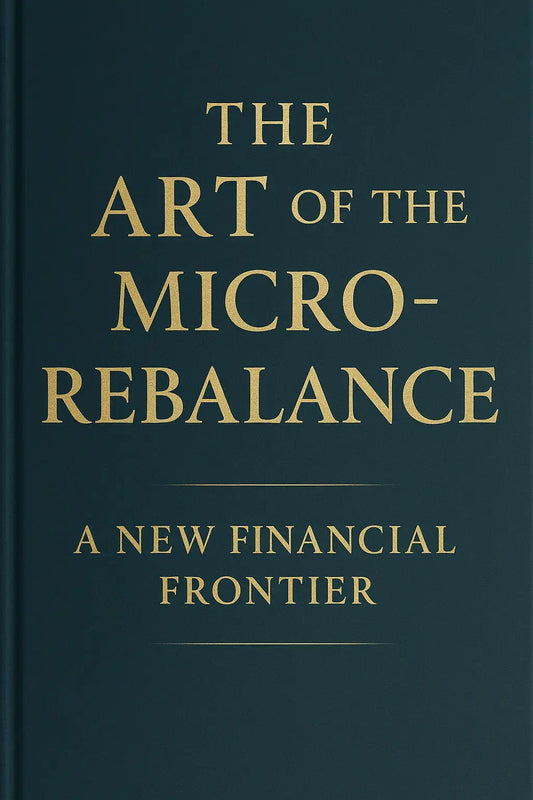
MicroRebalancing: The Art of the Micro-Rebalance - Standard Edition
- 270+ pages of complete system documentation
- 20+ simulations and backtests
- Real trade examples and optimization techniques
- Advanced strategies and position management
- $15
Get Micro-Rebalancing Standard →
This Isn't Theory. It's What Happened.
Most investing strategies hide behind marketing or hypotheticals.
We're showing you:
- ✅ Every trade executed
- ✅ Every confirmation timestamped
- ✅ Every spreadsheet entry matched
- ✅ Every result documented
The question isn't whether MicroRebalancing works.
The data proves it does.
The question is: How long are you going to let your money sit idle while the market moves?
Disclaimer
This information is for educational purposes only. Nothing contained herein constitutes financial, legal, or tax advice. Always consult a licensed financial professional before making investment decisions. The securities mentioned are examples only, not recommendations. All investing involves risk. Past performance does not guarantee future results. MicroRebalancing results reflect actual trades executed under specific market conditions and may not be repeatable.
IndexRebalancing.com / MicroRebalancing.com and its affiliates are not financial advisors or broker-dealers.
Complete Micro-Rebalancing Library
-
Investing Made Easy: Introduction to Institutional Style Management
Regular price $10.00 USDRegular price$10.00 USDSale price $10.00 USD -
Index Rebalancing: The Smarter Way to Invest in ETFs
Regular price $5.00 USDRegular price$10.00 USDSale price $5.00 USDSale -
The Art of the Micro-Rebalance: The New Financial Frontier
Regular price $15.00 USDRegular price -
Exclusive VIP Access - All Books | Lifetime Updates | Tools | Scripts | BEST VALUE
Regular price $37.00 USDRegular price


